Student Registration
Streamlining a high-stakes, time-sensitive academic moment
Course registration is one of the most consequential moments in the student experience. During peak registration periods, students compete for limited course availability while navigating complex requirements, schedules, and system constraints.
For undergraduates, creating Saved Schedules was intended to make this easier by allowing students to plan and register for multiple courses at once. Instead, the experience had become unintuitive, inefficient, and prone to errors, creating unnecessary stress for students and additional support demands for faculty and advisors.
I led the UX design effort to rethink the scheduling workflow and create a faster, clearer, and more resilient registration experience.
My Role
Lead UX Designer
I led discovery, experience strategy, interaction design, prototyping, and usability validation, partnering closely with Product, UX Research, Engineering, QA, and institutional stakeholders to take the work from early exploration through scaled implementation.
The Challenge
Students needed to make complex decisions quickly:
Which courses fit their degree requirements?
Which sections were still available?
Do the meeting times conflict?
What happens if a section fills?
How can I swap or remove a course without starting over?
The existing workflow required students to hold too much information in their heads and navigate repeatedly between disconnected steps.
Our hypothesis was that reducing cognitive load and improving system feedback would help students create conflict-free schedules faster, leading to smoother registration and fewer support issues.
Discover & Research
We began by understanding the existing experience from both sides of the system.
I mapped the end-to-end registration workflow, conducted heuristic evaluations, and partnered with researchers to interview students and faculty. We also used site visits and in-context observation to understand how registration actually happened during high-pressure periods.
This revealed a consistent pattern: the problem wasn't simply the number of steps. The experience made students repeatedly reconstruct the context they needed to make decisions.
Outcomes
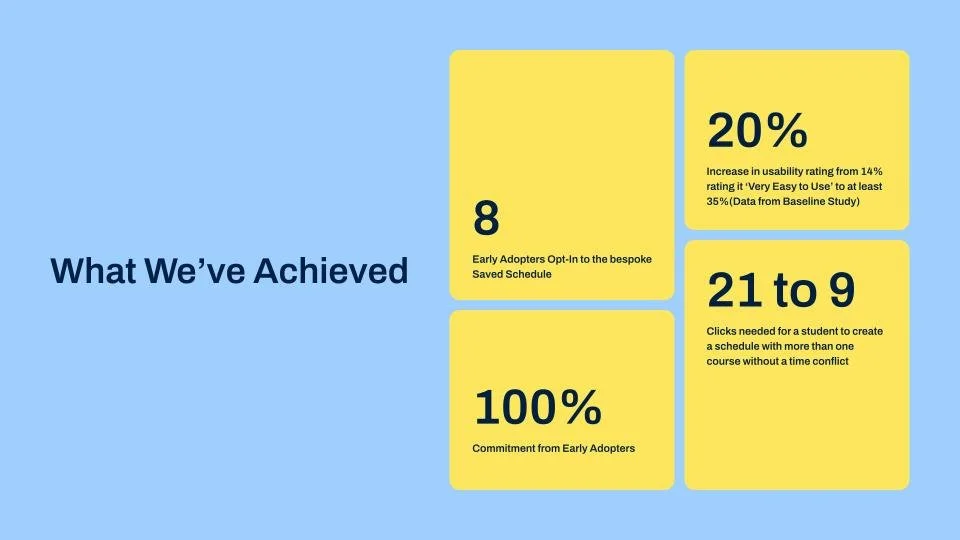
21 → 9 clicks to complete a Saved Schedule registration
+20% increase in students rating the experience “very easy to use”
Scaled from 1 → 4 scrum teams following strong adoption and roadmap expansion
Reduced registration friction and created more capacity for faculty and advisors by addressing common support issues
Flow Map
Outline of a typical instruction period.


Early Insights
In order to understand the problem, we first needed to understand the current experiences and the user needs. I organized a an analysis of the current experience and conducted user interviews with students and faculty.
Current Experience
Flow for adding a course to an existing saved schedule.
Initiating Screen
Browse Courses
Course Details
Methodology: Heuristic Evaluation, User Interviews, & Site Visits
Choose Times
Summary
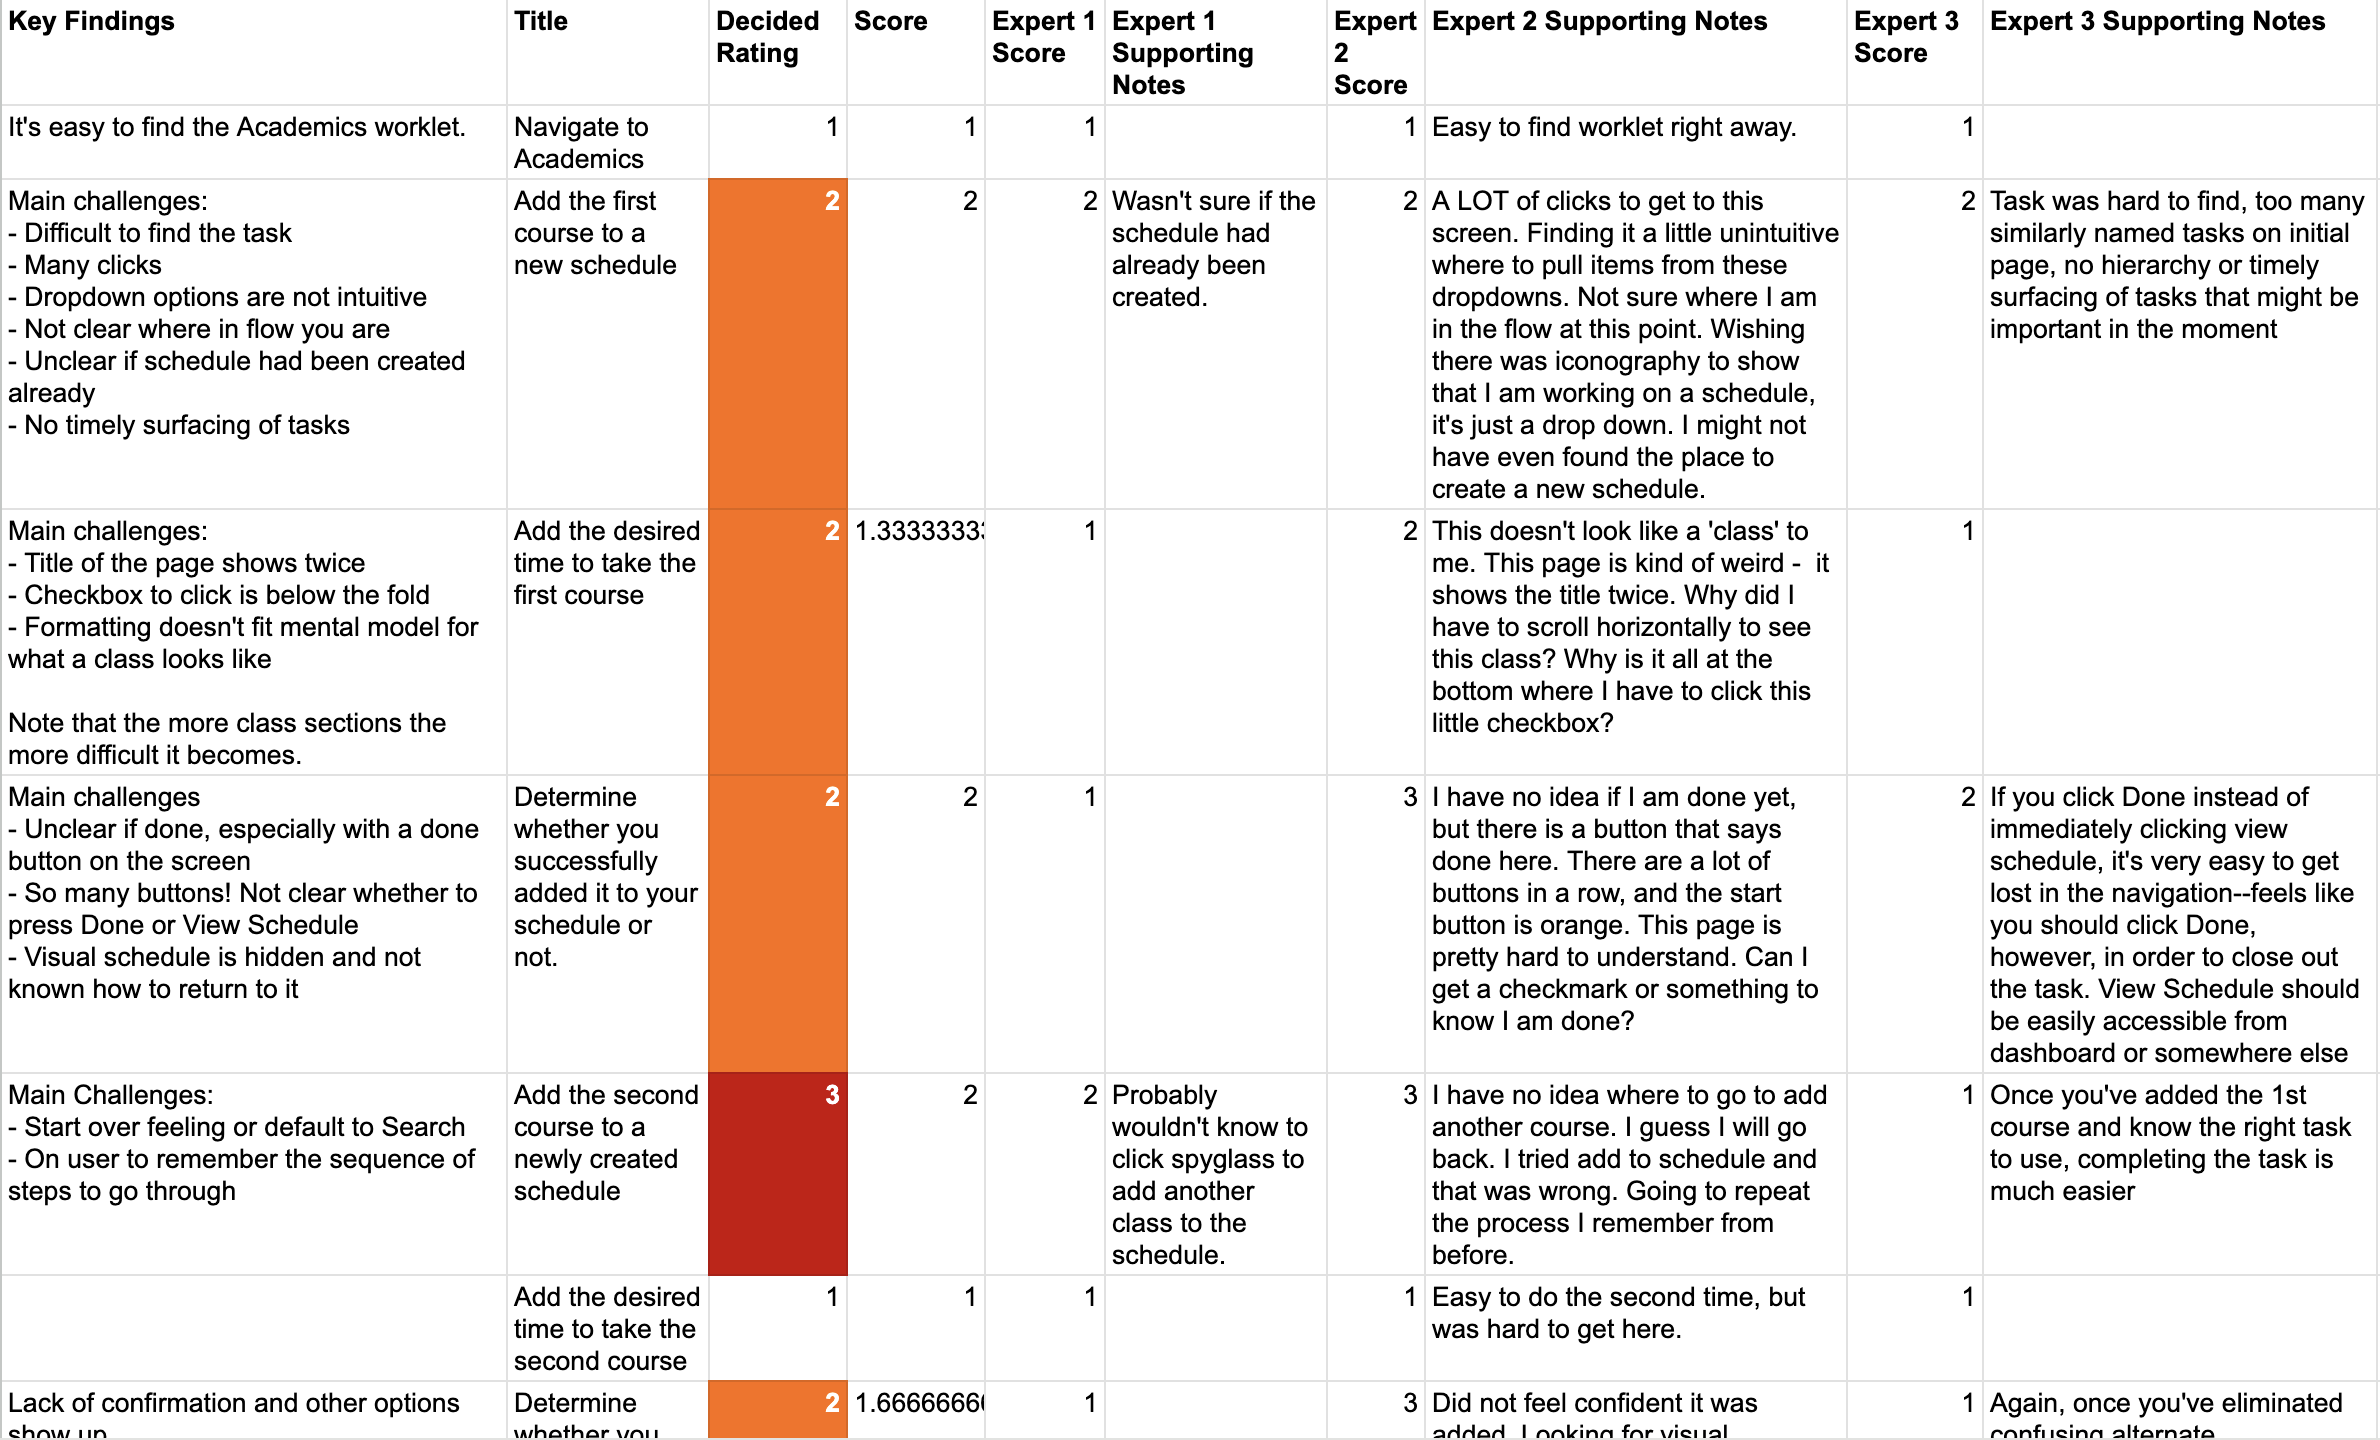
Heuristic Evaluation
The Goal
Expose areas of improvement . UX researchers and designers were asked to review tasks independently and come together and discuss individual ratings focused on rating areas of friction across tasks. This gave us an initial baseline to measure improvement over time.

Early insights from students
“It is difficult to visual how courses line up and to avoid time conflicts.”

“Navigating was clunky. It would be helpful to see course options without having to go back to the main list as if you are starting over.”

“I want to easily remove or swap a course sections.”

The faculty perspective
What advisors told us:
Unfortunately, when registration is too difficult Students give up.
Design Concepts
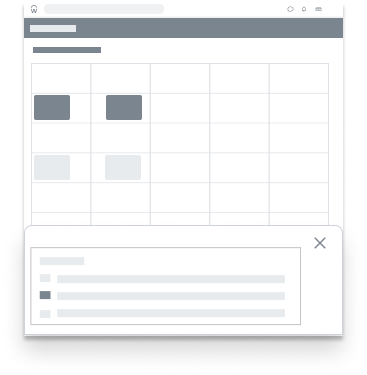
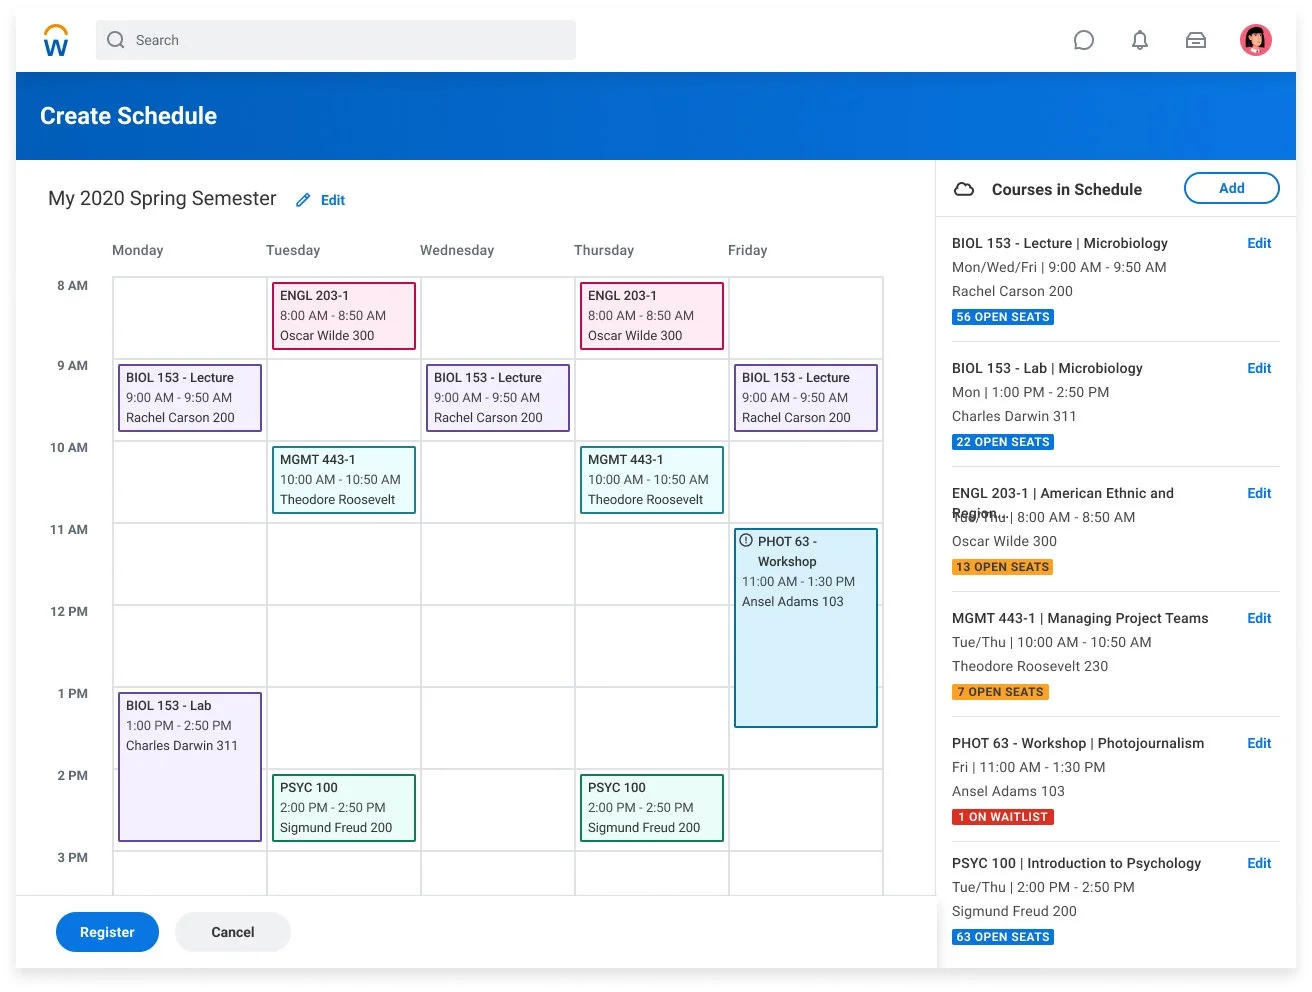
Low Fidelity mocks and wireframing
The Goal
Use design as a tool to communicate with the team and imagine a direction. Share with the product managers, developers, and QA to gain early alignment.

-
The UX + Registration team aims to enhance students plan their classes to make a saved schedule and register.
-
Inventory + reflection on the current tools used by students
Interview to review prototype of the design proposal
-
How are students expecting to interact with their courses in a calendar?
Is the current design proposal easy and intuitive to interact with? Specifically:
Searching and filtering
Editing
Section dependent registration
-
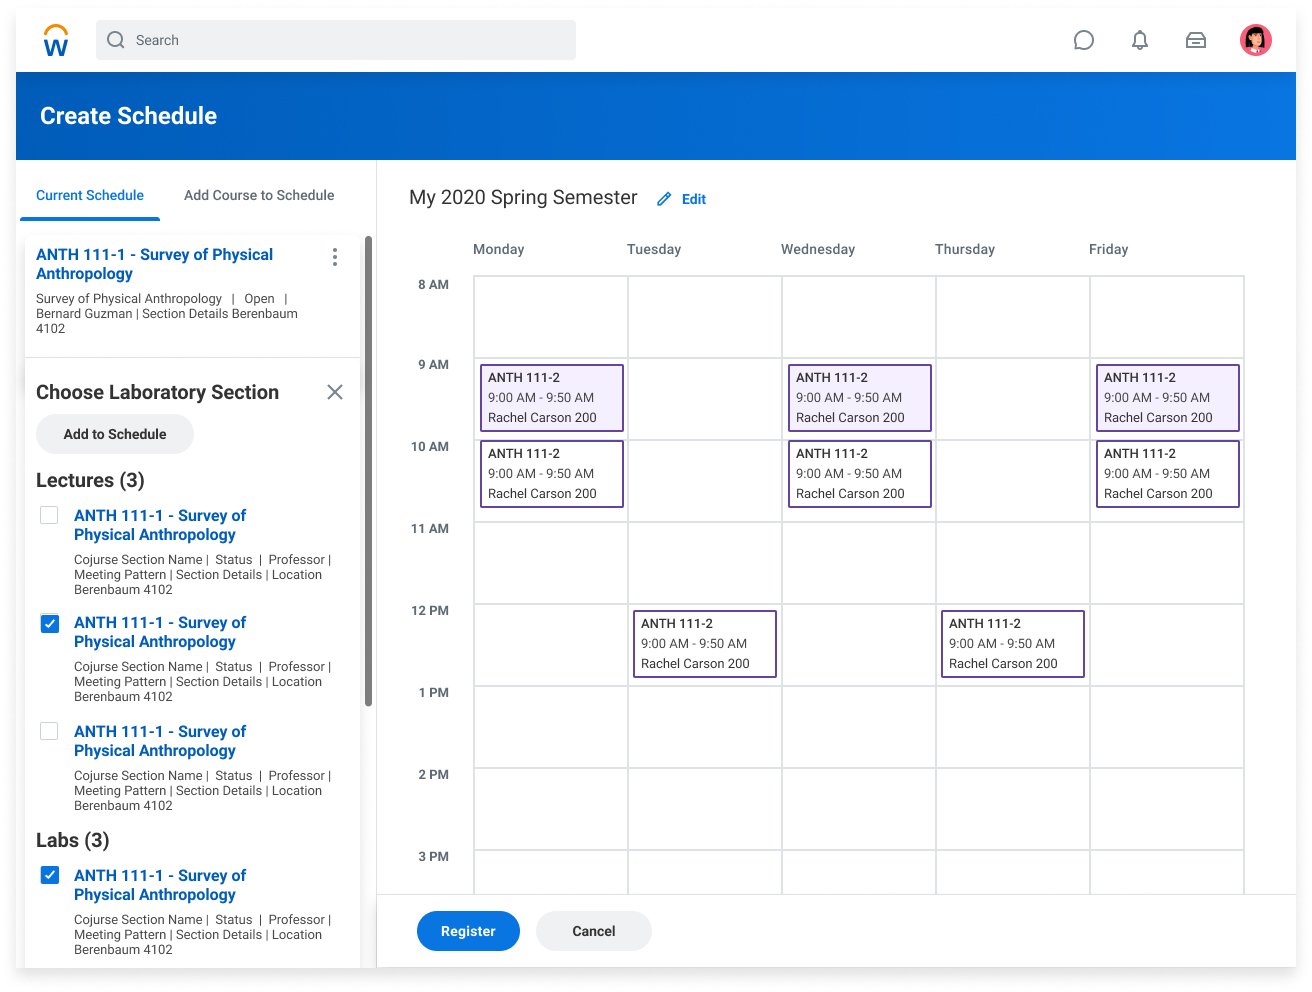
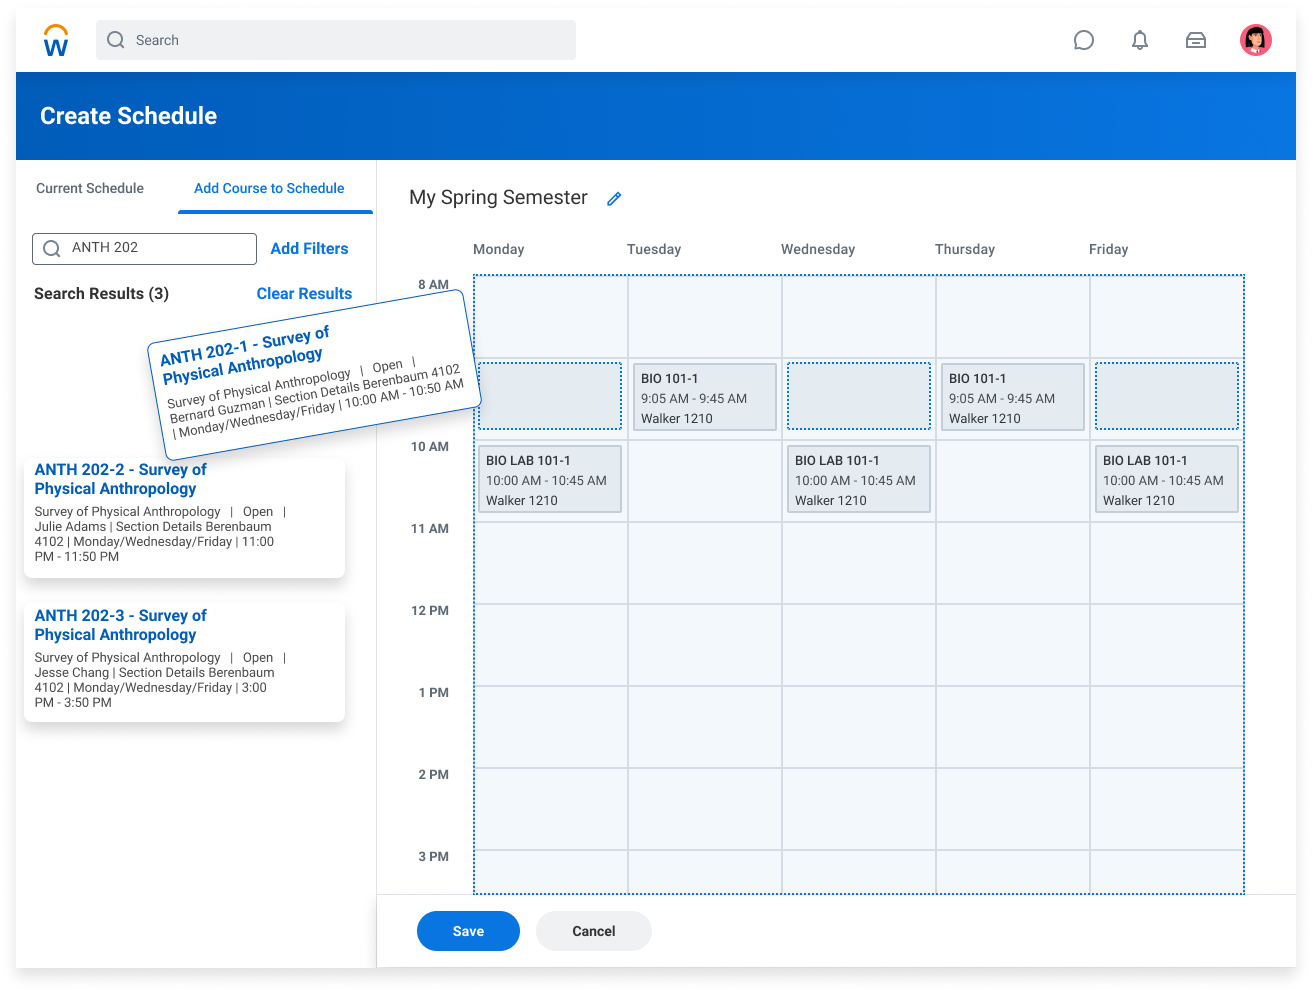
We learned that the bespoke visual calendar exceeds expectations for student software. In addition, we learned that there are some improvements to make to the usability of the task

User Research
This video compilation captures encouraging feedback from users interviewed during testing.
Refine Prototype and Design
After analyzing findings from research, a polished prototype was created and designs were specced out for development.
Measuring Our Impact
Impact was measured through ongoing qualitative feedback, adoption, and quantitative usage data to identify opportunities for continuous improvement.
Direct, qualitative feedback from key stakeholders, helping assess how well the new design meets business needs.
Design Partner Groups
Offer a first look at the experience, revealing any issues before a full rollout.
Early Adopter Groups
Using tools to measure feature adoption, engagement, and task completion rate.
Tracking Usage